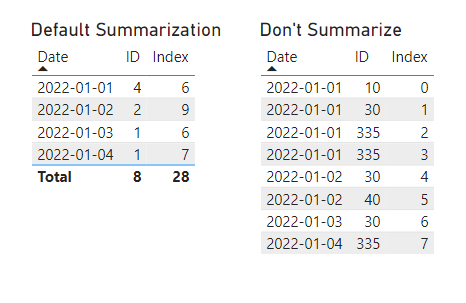
DAX measure basics in Power BI or Excel data model
I decided to share my tips for learning DAX. 1. Learn about filter context; 2. use variables to debug measures, and 3. understand how CALCULATE works. At the end, I link two of my blog posts: one which applies the concepts of coordinates and values to the different visualizations available in Power; the other is how to troubleshoot the trickiest visual of them all: the table visual.
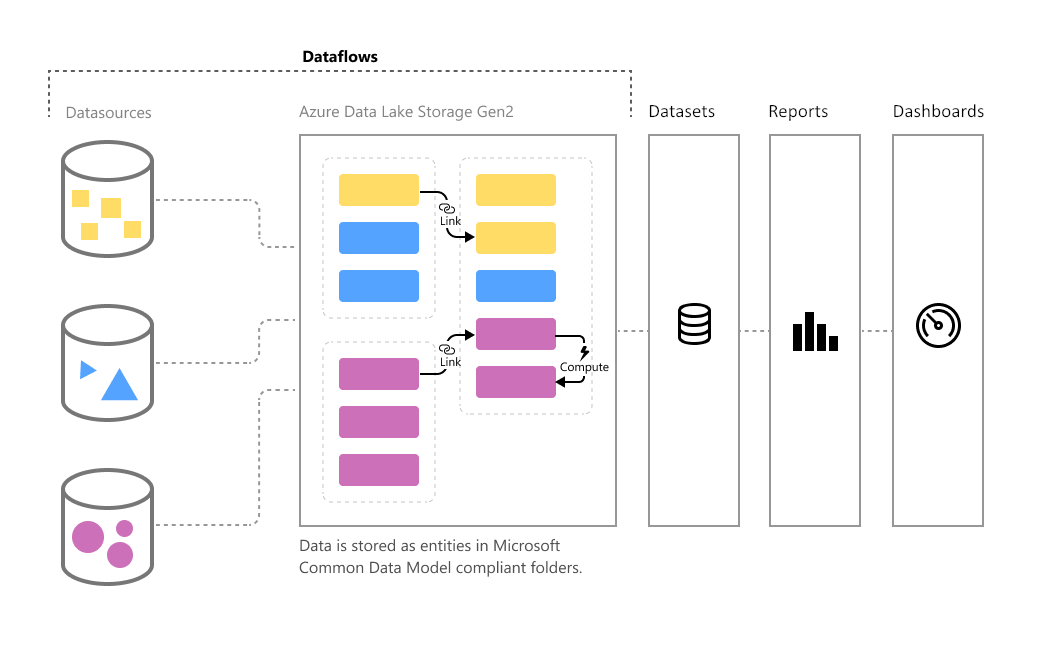
Rapidly Rebuild Enterprise BI with Power BI Dataflows
As a first step in moving from traditional BI to Power BI, build a data mart using Power BI dataflows.
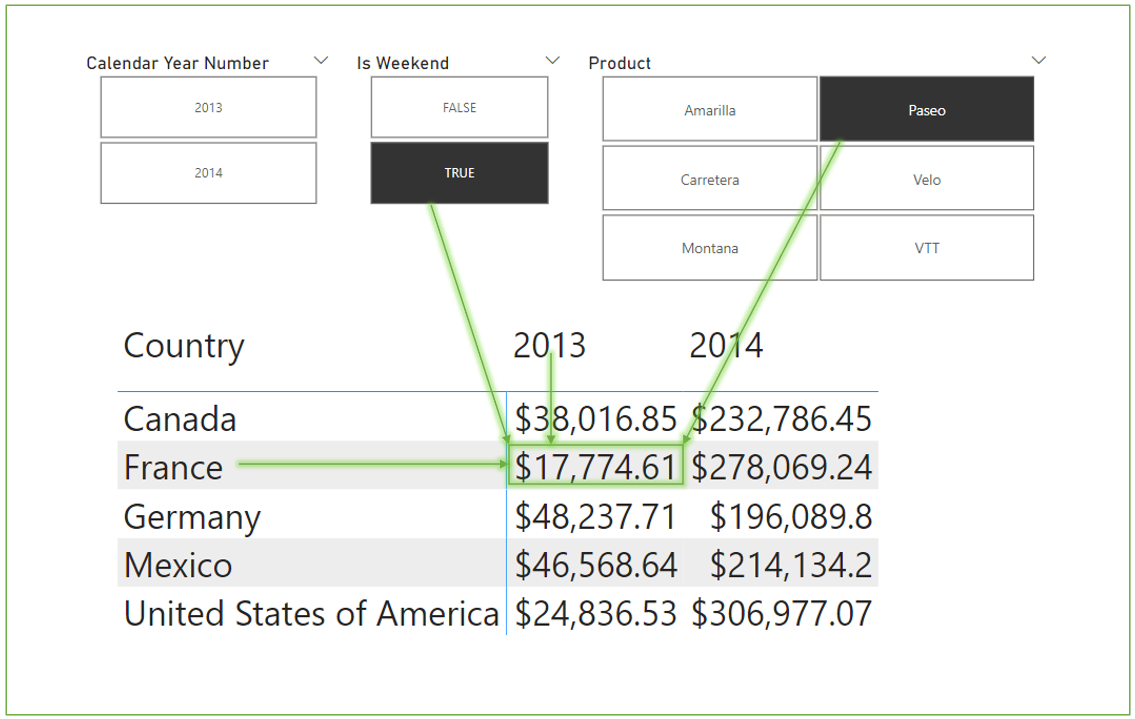
Troubleshooting Problems with Power BI Table Visuals
You can easily start using table visuals without having to know how they work under the hood. When you run into a problem, that’s when knowing about the mechanics becomes helpful.